
Erstellen eines Spektrogramms (Bild)
Der folgende Befehl zeichnet eine WAV-Datei mit ALSA (Device 2.0) auf.
In diesem Beispiel wird Sox in den Prozess eingefügt – was in diesem Fall eigentlich unnötig ist – aber dennoch verwendet werden könnte, um verschiedene Filter auf die resultierende test.wav-Datei anzuwenden:
arecord -D hw:2,0 -r 32000 -f S16_LE -c 1 -t wav | sox -t wav -c 1 -L -b 16 -r 32000 - test.wavMit der neu erstellten Datei test.wav kann nun ein Spektrogramm erstellt werden:
sox test.wav -n spectrogram -o image.pngDer folgende Befehl erstellt eine WAV-Datei mit Alsa (Device 2.0). In diesem
Fall wird zusätzlich Sox über die Pipeline geleitet, was hier völlig unnötig ist,
Allerdings könnte Sox der resultierenden test.wav noch verschiedene Filter hinzufügen
ändern:
arecord -D hw:2,0 -r 32000 -f S16_LE -c 1 -t wav | sox -t wav -c 1 -L -b 16 -r 32000 - test.wavMit der soeben erstellten Datei test.wav wird nun ein Spektrogramm erzeugt:
sox test.wav -n spectrogram -o image.png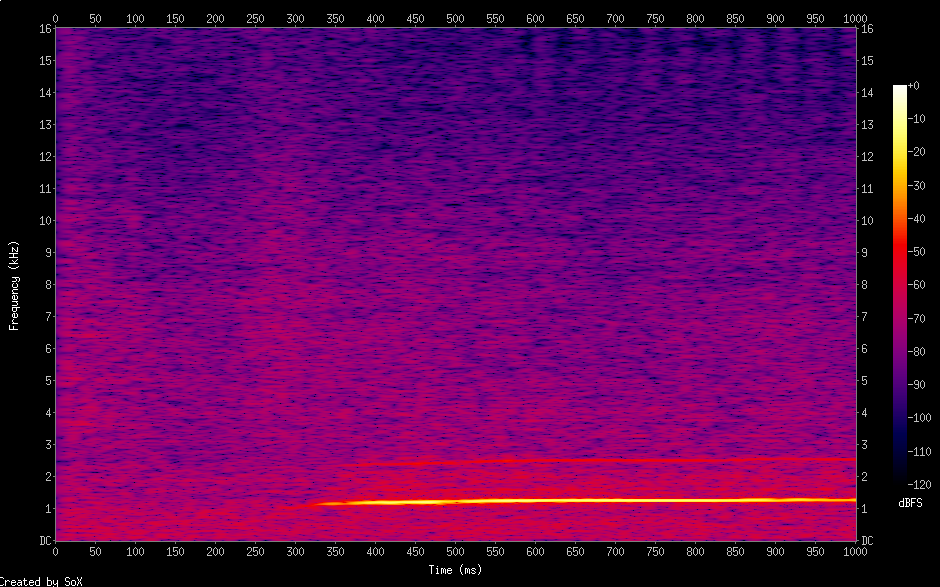
Ein ähnliches Spektrogrammbild kann mit avconv direkt aus einer Videodatei erstellt werden:
avconv -i test.avi -lavfi showspectrumpic=s=hd480:legend=0,format=yuv420p out.png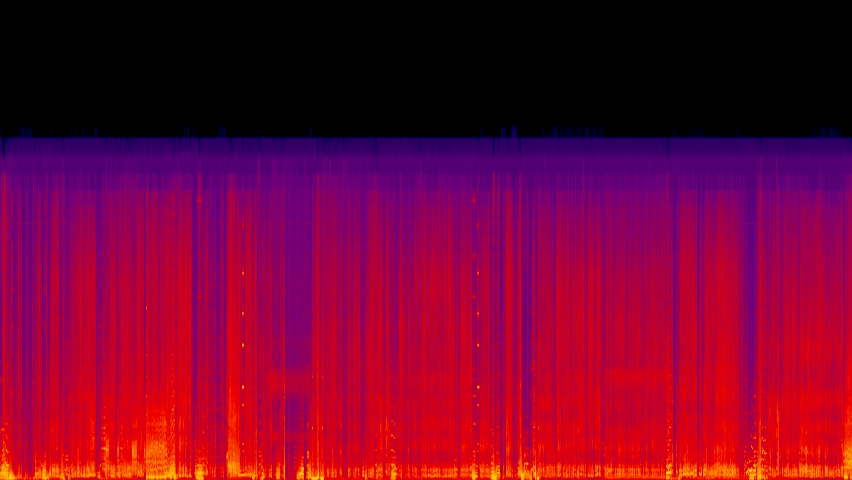
Erstellen eines Spektrogramms (Video)
Die folgende Anweisung erstellt ein Spektrogramm aus einem Video test.avi. Dieses wird als Video unter dem Namen out.avi gespeichert.
Anstelle von avconv hätte auch ffmpeg verwendet werden können. Die Debian-Version unterstützt hier derzeit nicht alle Parameter.
Alternativen mit MPlayer und Sox
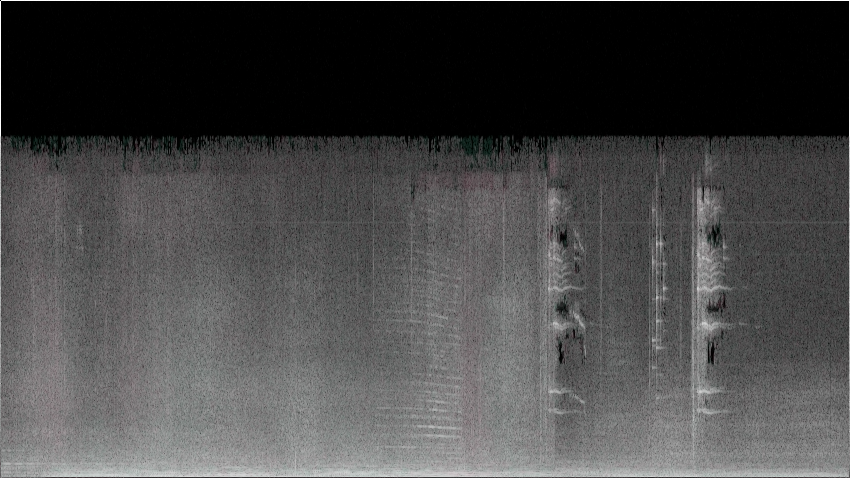
Sie können auch ein Spektrogramm aus einem Video mit mplayer oder einer Kombination aus mplayer und sox erzeugen.
Extrahieren Sie zunächst eine WAV-Datei mit mplayer:
mplayer test.mp4 -ao pcm:file=/dev/stdout -vo null > test.wavErstellen Sie dann das Spektrogramm:
sox test.wav -n spectrogram -o test.pngVergleich von Spektrogrammen:
Auf diese Weise erstellte Spektrogramme können direkt verglichen werden.
Doch selbst bei scheinbar identischen WAV-Dateien kann dieser Vergleich schwierig sein.
Um Unterschiede besser sichtbar zu machen, empfiehlt es sich, ein Spektrogramm diff zu erstellen.
Erstellen Sie zunächst eine Diff-WAV-Datei:
sox -m -v 1 source1.wav -v -1 source2.wav diff.wavDann erzeugen Sie das Spektrogramm diff:
sox diff.wav -n spectrogram -o diff.png