Create a spectrogram (Image)
The following command creates a WAV file using Alsa (Device 2.0). In this
case, Sox is additionally piped, which is completely unnecessary here,
however, Sox could still add various filters to the resulting test.wav
change:
arecord -D hw:2,0 -r 32000 -f S16_LE -c 1 -t wav | sox -t wav -c 1 -L -b 16 -r 32000 - test.wavUsing the file test.wav that has just been created, a spectrogram is now generated:
sox test.wav -n spectrogram -o image.pngThe following command creates a WAV file using Alsa (Device 2.0). In this
case, Sox is additionally piped, which is completely unnecessary here,
however, Sox could still add various filters to the resulting test.wav
change:
arecord -D hw:2,0 -r 32000 -f S16_LE -c 1 -t wav | sox -t wav -c 1 -L -b 16 -r 32000 - test.wavUsing the file test.wav that has just been created, a spectrogram is now generated:
sox test.wav -n spectrogram -o image.png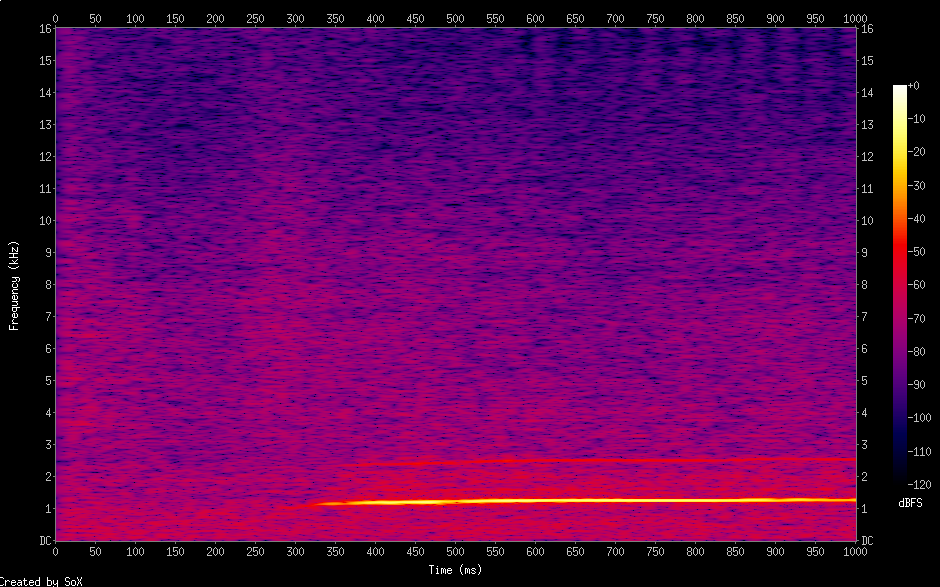
Similar can also be created using avconv:
avconv -i test.avi -lavfi showspectrumpic=s=hd480:legend=0,format=yuv420p out.png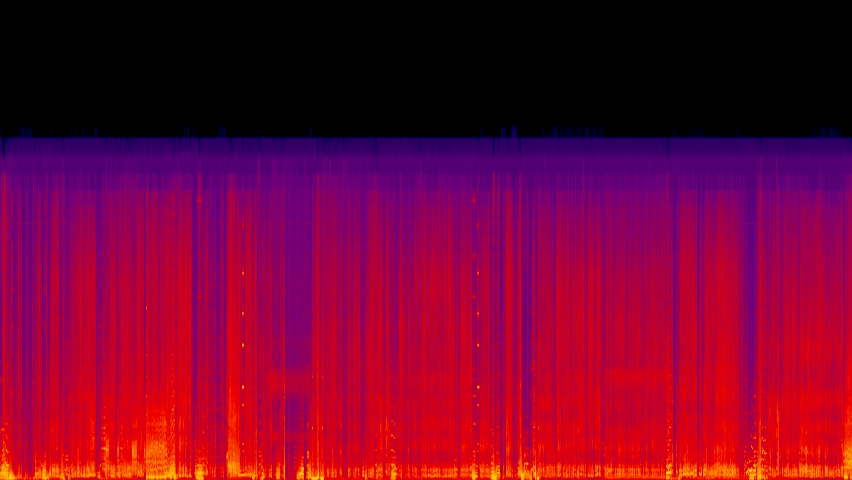
Create a spectrogram (Video)
The following instruction creates a spectrogram from a video test.avi. This is saved as a video under the name out.avi.
Instead of avconv, ffmpeg could also have been used. The Debian version does not currently support all parameters here.
Alternatives
A spectrogram of a video can also be created with mplayer or with the
mplayer/sox combination.
First a WAV file is created using MPlayer:
mplayer test.mp4 -ao pcm:file=/dev/stdout -vo null > test.wavThis is followed by the creation of the spectrogram:
sox test.wav -n spectrogram -o test.pngThe graphics created in this way can be compared directly. With some
(apparently identical) WAV files this can be difficult.
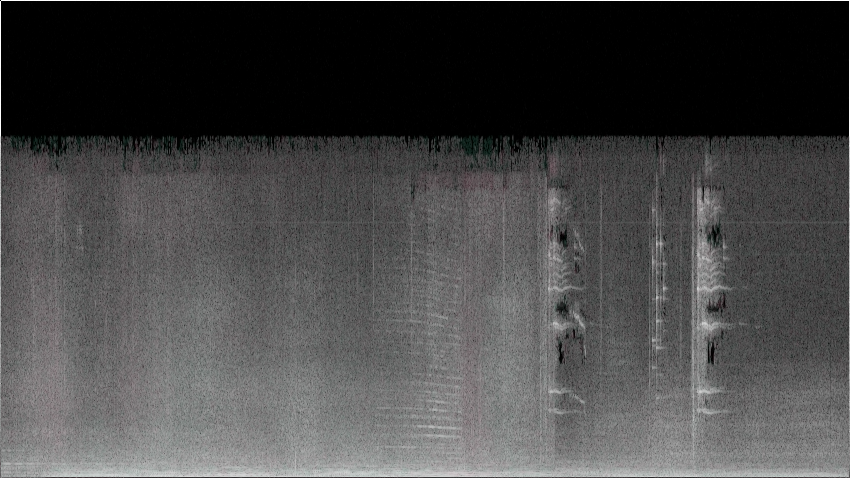
For this reason, the display of a spectrogram diff is recommended.
First a WAV diff is created:
sox -m -v 1 source1.wav -v -1 source2.wav diff.wavThen the spectrogram diff is created:
sox diff.wav -n spectrogram -o diff.png